
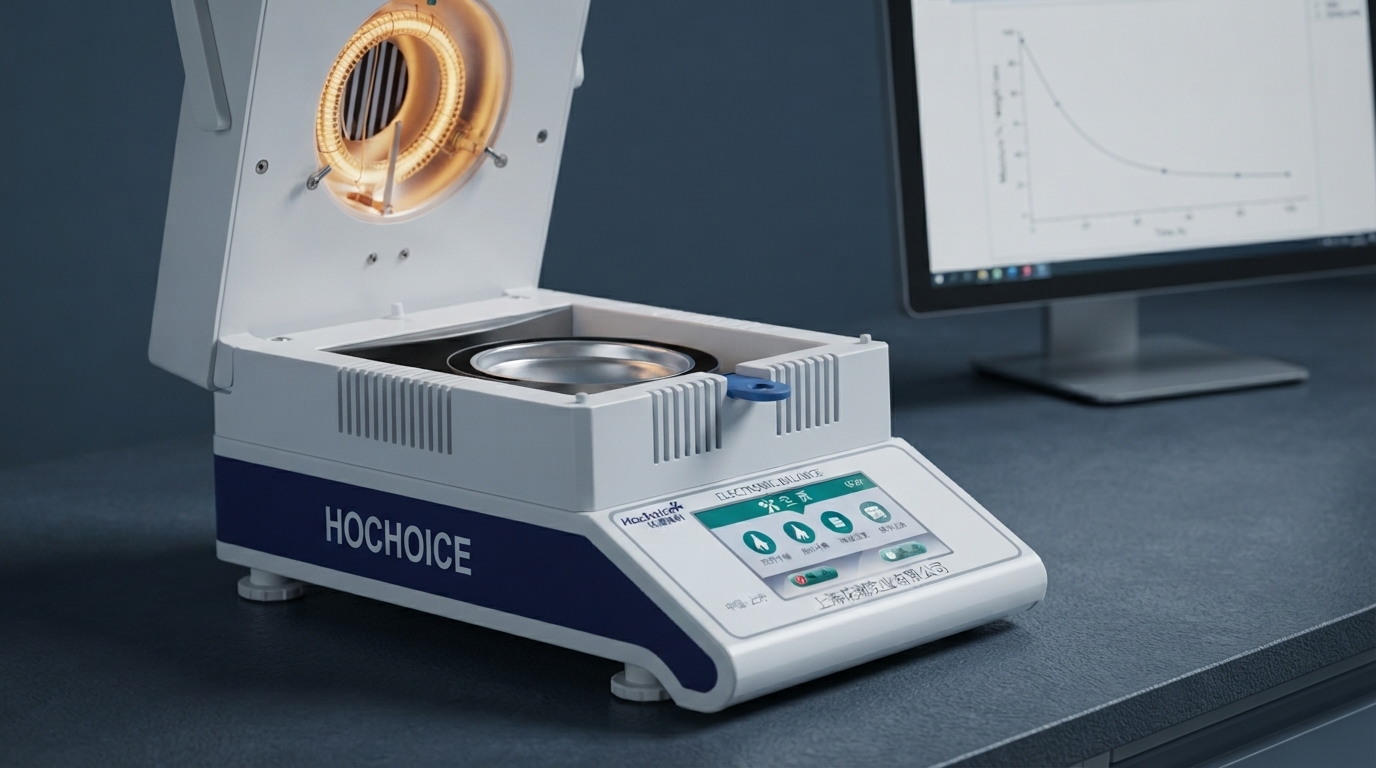
A halogen moisture analyzer provides more than a final moisture percentage. When the instrument supports drying-curve display or data export, the curve can help laboratory users understand how a sample loses mass during heating and whether the selected drying program is appropriate for the material.
Learning to interpret this information can help improve method development, identify inconsistent test behavior, and make moisture results more useful for quality control.
A drying curve shows how a sample's measured mass or calculated moisture content changes over time during a drying test.
Depending on the instrument and its software, the horizontal axis typically represents time, while the vertical axis may represent moisture content, mass loss, or remaining mass.
As the sample heats up, moisture and potentially other volatile components leave the material. The balance continuously records mass changes, allowing the instrument to calculate and display the result according to its selected measurement mode.
Not every halogen moisture analyzer displays a drying curve directly. On models without this feature, exported measurement data or recorded results may provide similar information.
At the beginning of the test, the sample absorbs heat and its temperature increases. Depending on the material, mass loss may initially be slow before moisture release becomes more pronounced.
A short delay does not necessarily indicate a problem. Sample composition, temperature settings, sample quantity, and heat transfer all influence the curve.
As heating continues, moisture may evaporate more rapidly, producing a steeper change in the curve.
The shape of this section depends on the material. A thin, evenly distributed sample may dry differently from a thick or uneven layer.
As drying progresses, less readily available moisture may remain, and the rate of mass loss can decrease.
The curve may gradually flatten as the test approaches its endpoint. However, a flattening curve alone does not prove that all moisture has been removed.
The instrument ends the test according to its configured time or endpoint criterion.
The final result should be interpreted together with the test method, sample characteristics, and any applicable reference procedure. A test can terminate without establishing that the sample has reached a chemically complete or universally correct drying state.
| Observed curve behavior | Possible interpretation | What to investigate |
|---|---|---|
| Rapid initial mass loss | Readily released moisture or other volatile components | Confirm the sample and heating method are suitable |
| Gradual, continuous mass loss | Moisture is being released slowly | Review sample thickness, temperature, and test duration |
| Curve flattens early | The sample may have reached the selected endpoint, or drying may be limited | Check the endpoint criterion and compare with an appropriate reference method |
| Sudden changes or irregular steps | Sample movement, splashing, uneven heating, or other disturbances may be involved | Inspect sample behavior and repeat the test under controlled conditions |
| Different curves for nominally identical samples | Sample heterogeneity or inconsistent preparation may contribute | Standardize sampling, sample quantity, and distribution |
These patterns are diagnostic clues rather than definitive proof of a particular cause. A drying curve should be interpreted in the context of the material and measurement method.
Sample preparation has a direct influence on heat transfer and moisture release.
Uneven sample distribution: Thick piles can dry less uniformly than a thin, even layer, creating differences in drying rate.
Inconsistent sample quantity: Different sample masses can change the drying duration and may affect repeatability.
Particle size differences: Larger particles may release moisture more slowly than smaller particles, depending on their structure and composition.
Sample heterogeneity: Materials with uneven moisture distribution can produce different curves even when the same nominal test method is used.
Moisture exchange before testing: Hygroscopic materials can absorb moisture from the surrounding air, while volatile samples may lose mass before heating begins.
Standardizing sample collection, preparation, handling, and loading helps make curves more comparable between tests.
Temperature affects the rate of drying, but a higher temperature is not automatically better.
If the temperature is too low for the selected method, moisture may be released slowly and the test may take longer. If the temperature is too high, the sample may decompose, form a surface crust, or release substances other than water.
When developing a method, evaluate the curve together with the final result, the appearance of the sample, repeatability, and any available reference measurements.
For materials with established oven-drying methods or other accepted reference procedures, compare results under appropriately controlled conditions. The goal is to establish a reliable and reproducible method, not simply to produce the shortest test.
Drying curves can be useful during method development and troubleshooting.
For example, a laboratory can compare curves from repeated tests to investigate whether differences arise from sample preparation, drying settings, or the material itself.
A consistent curve shape and similar final results may support repeatability, but they do not independently establish measurement accuracy. Accuracy requires comparison with an appropriate reference or other suitable verification procedure.
For routine quality control, laboratories should define acceptable test parameters, record relevant settings, and investigate results that fall outside established criteria.
Review the method if the curve changes substantially between comparable samples, the instrument repeatedly reaches its endpoint too quickly, drying takes unexpectedly long, or the final moisture results no longer meet established acceptance criteria.
Check the sample preparation, environmental conditions, heating program, and endpoint settings before concluding that the instrument is defective.
If the problem persists, perform the appropriate instrument checks according to the manufacturer's instructions and compare the method with a suitable reference procedure where applicable.
A drying curve can reveal how a sample loses mass throughout a halogen moisture analysis, providing useful information about drying behavior, endpoint selection, and test repeatability.
By interpreting the curve alongside sample preparation, temperature settings, and reference results, laboratories can develop more consistent moisture-testing methods and make better-informed quality-control decisions.
The curve is a valuable analytical aid, but its meaning depends on the material, the selected method, and the capabilities of the moisture analyzer.